workplacify
Create professional hybrid workplace policies
Calculate potential savings from optimizing desk usage
Create professional visitor badges with QR codes
Calculate how much office space you can save with hybrid work
October 6, 2025
Workplacify Analytics: Turn Desk Booking Data into ROI

Kevin Peters
CEO of Workplacify
Making decisions about your office space without data means risk. Are you paying for square footage that sits empty? Are teams missing out on collaboration because popular days are overcrowded? The right analytics reveal patterns, eliminate guesswork, and lead directly to better outcomes.
We are introducing Workplacify Analytics, a dashboard that turns desk booking data into ROI. In this article, we explore Base Analytics and People Analytics, and show how to use these insights to justify real estate changes, improve productivity, and support a better hybrid experience.
What is Workplacify Analytics and Why Does It Matter?
Workplacify Analytics translates raw booking data into simple, actionable insights. It answers questions like: How much space do we really need? Which days are most popular for in-office collaboration? Are our workplace policies working? Every empty desk represents a cost, and every frustrated employee who can not find a spot represents a productivity risk. With data, you replace guesswork with decisions that save money and improve the employee experience.
Introducing Base Analytics: Your Office's Vital Signs
Base Analytics provides a high-level overview of space utilization. It highlights overall desk utilization, your peak day, and daily utilization trends so that you can see patterns at a glance and communicate clearly with stakeholders.
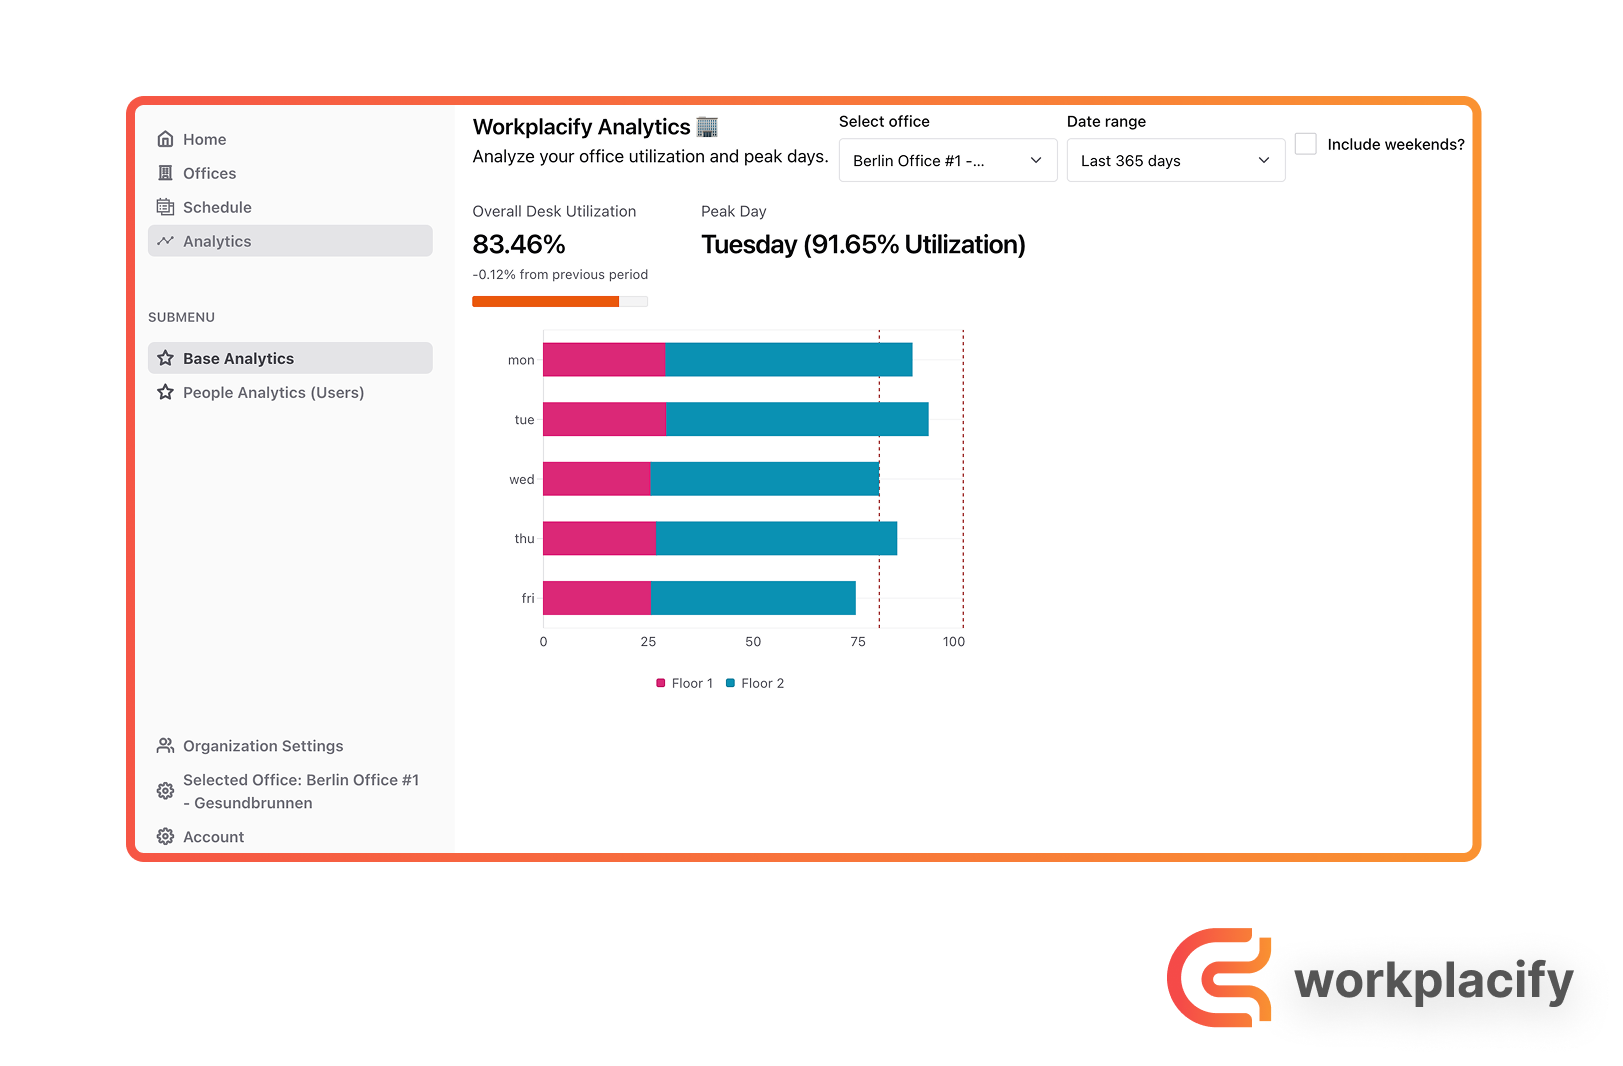
Overall Desk Utilization: The percentage of available desks booked over a period, with trend deltas to track direction.
Peak Day: Instantly shows the busiest day of the week to help plan staffing, cleaning, and collaboration resources.
Daily Utilization Graph: A clear view of which days are popular versus quiet.
Filters support office-level and portfolio views and let you choose ranges from the last 7 to 365 days. Historical desk booking data is essential for forecasting and real estate planning.
Introducing People Analytics: Understanding How Your Teams Work
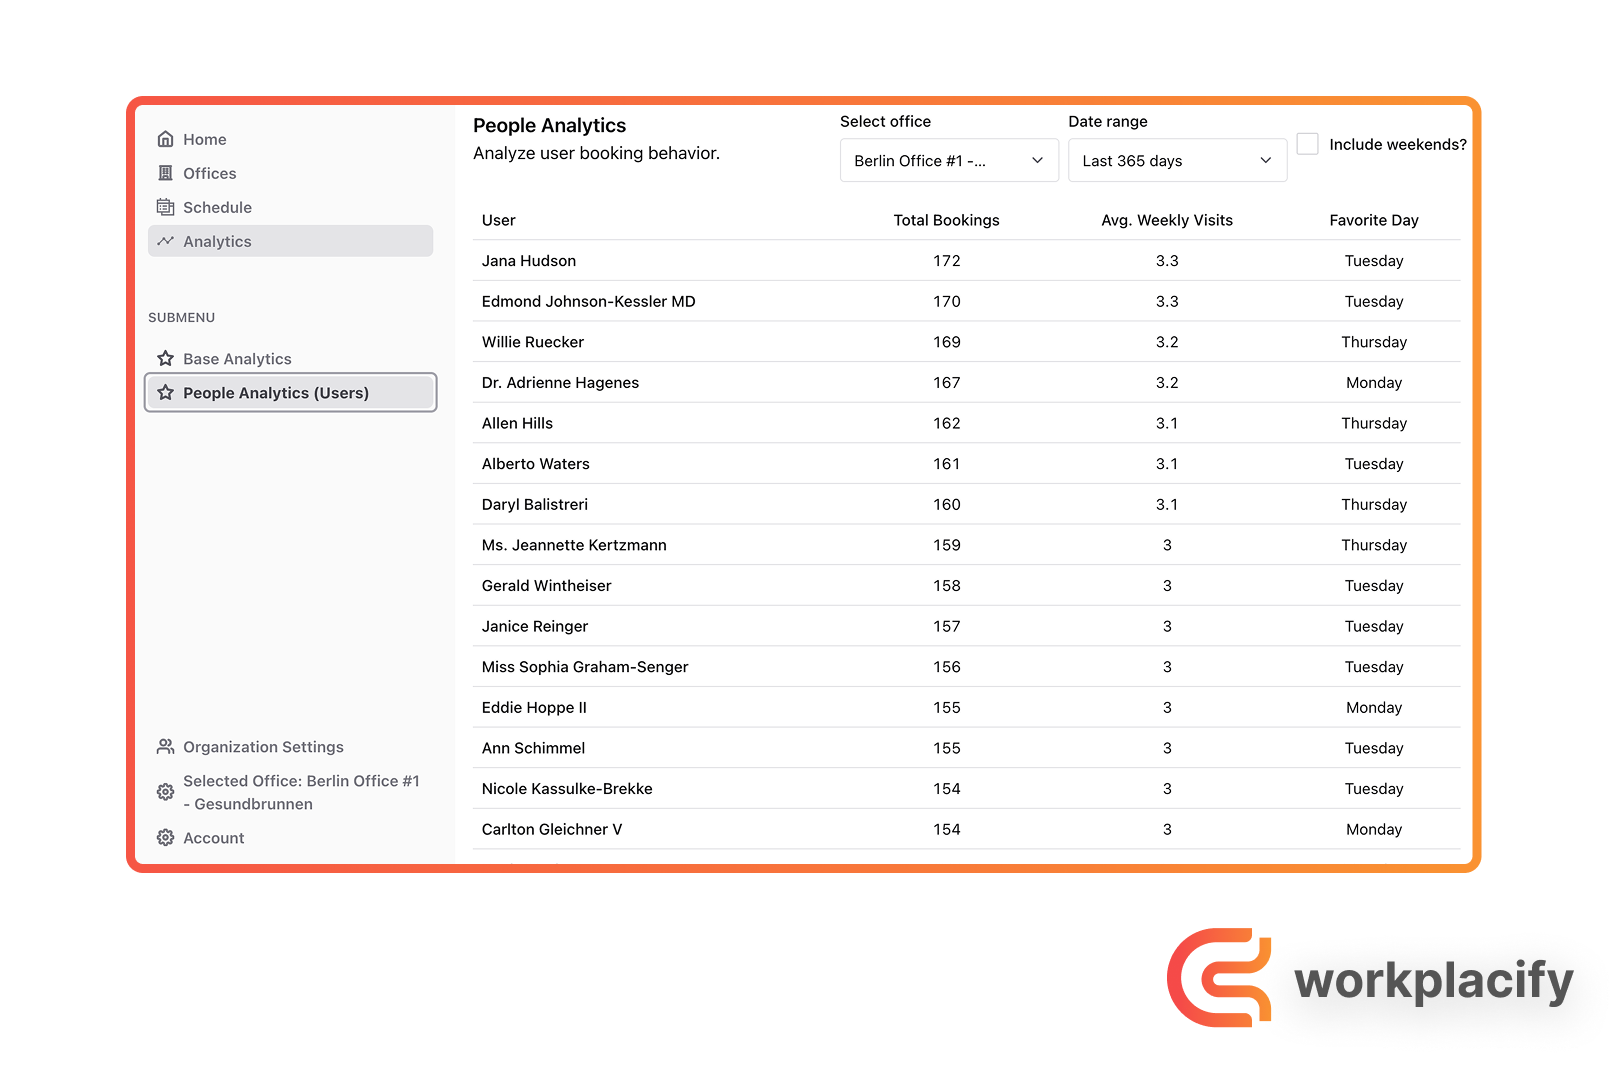
People Analytics shifts focus from space to people. It reveals total bookings, average weekly visits, and favorite day per person, helping leaders coordinate team days organically and identify champions or gaps in adoption.
The Business Case: Calculating ROI with Office Analytics
1. ROI from Real Estate Savings
Use utilization and peak data to right-size your footprint. For example, if one floor averages 30% utilization, consolidating or subleasing can yield substantial savings, often dwarfing software costs.
2. ROI from Productivity and Collaboration Gains
Eliminate Booking Friction: A reliable desk booking flow saves minutes per employee per week. Try our Desk Scheduling Efficiency Calculator to estimate your impact.
Facilitate Intentional Collaboration: Departmental trends guide when to schedule cross-functional sessions. As noted in McKinsey's hybrid work guidance, making in-office time purposeful is key.
Optimize for Peak Days: Use peak-day insights to align staffing, catering, and room readiness. The JLL Future of Work survey shows how organizations adapt operations to demand patterns.
3. ROI from Employee Retention and Experience
Data-Driven Policy Making: Build policies around observed behavior instead of arbitrary rules. Learn more about desk sharing vs. hot desking.
Ensure Fair Access: Use insights to prevent persistent access issues and create team zones when needed. According to Gartner research, equitable systems support retention and engagement.
Reduce Workplace Anxiety: Confirmed desks reduce stress and improve daily satisfaction.
Ready to Make Data-Driven Decisions?
Stop guessing and start knowing. See how Workplacify's Analytics optimizes space, cuts costs, and boosts employee satisfaction. Book a free demo.
Key Takeaways
Data Over Guesswork: Replace assumptions with clear usage data.
Two Views, One Goal: Base Analytics for space, People Analytics for behavior.
Clear Path to ROI: Savings via real estate, productivity, and retention.
Identify Peak Demand: Allocate resources on your busiest days.
Understand Team Cadence: Discover preferred in-office days per team.
Build Better Policies: Create hybrid policies from actual patterns, not mandates.
Simple and Actionable: Clear metrics that drive decisive action.
Conclusion
Managing a hybrid workplace now requires more than scheduling—it requires intelligence. With Workplacify Analytics, you gain accessible, actionable data on both spaces and people to end ghost offices and reduce hybrid friction. Present leadership with utilization-backed plans to adjust footprint, foster collaboration through behavioral insights, and improve satisfaction with a predictable, fair booking experience.
Spreadsheets vs. Analytics Dashboard
Manual spreadsheets are error-prone and offer little insight. An integrated analytics dashboard provides real-time visibility and decision support.
Spreadsheets
Manual & Error-Prone
Time-consuming updates and inconsistent data accuracy
No Trend Visibility
Hard to see peak days, patterns, or behavior
Poor Governance
No consistent rules or auditability
Workplacify Analytics
Real-Time Insights
Utilization, peak days, and people patterns at a glance
Actionable Decisions
Drive portfolio changes with confidence
Policy Feedback Loop
Use data to improve hybrid policies over time
Frequently Asked Questions (FAQs)
workplacify
© 2026 workplacify. All rights reserved